Introduction to API Manager


After figuring out the tables which are relevant for the each stat and modifying it according to get the corresponding data next step was writing the queries to fetch the data from database. For this I’ve followed the conventions used for API publisher statistic dashboard backend in coding.

For the fault count data the prevailing DTO of fault count could be used.
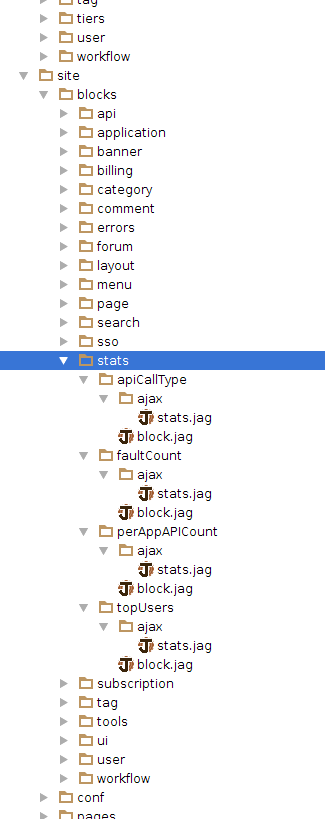

Above figure shows the file structure of the API store UI. Once the required methods were coded in apiStoreHostObject class to make them usable for that jaggery ui through rhino engine those methods should be added under a module. In the statistics directory under the module directory there are module.jag file and usage.file. In the usage.jag file those methods were accessed and return types were set. In the module.jag all those functions were taken in to one module called statistics.

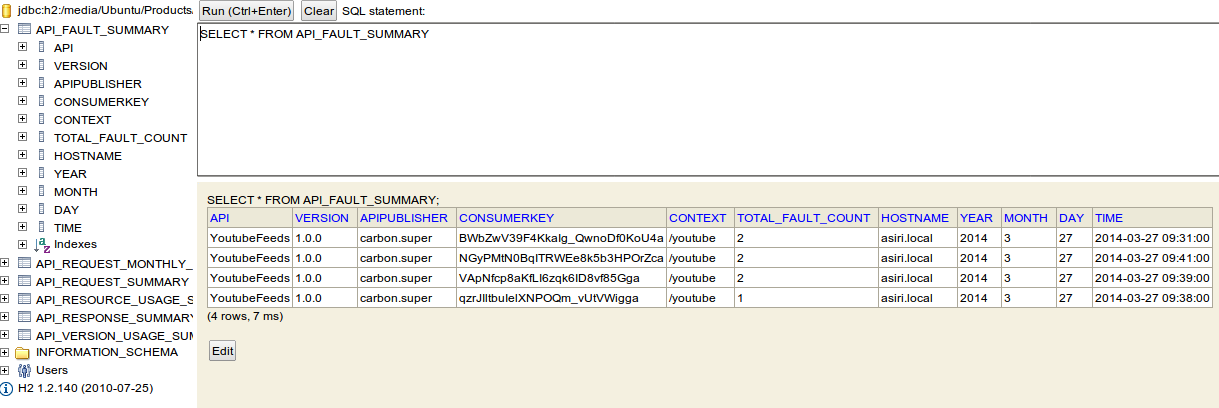
Faulty Invocations Per Application

Registered Users For Applications and Top Users For Applications

API Usage Per Application

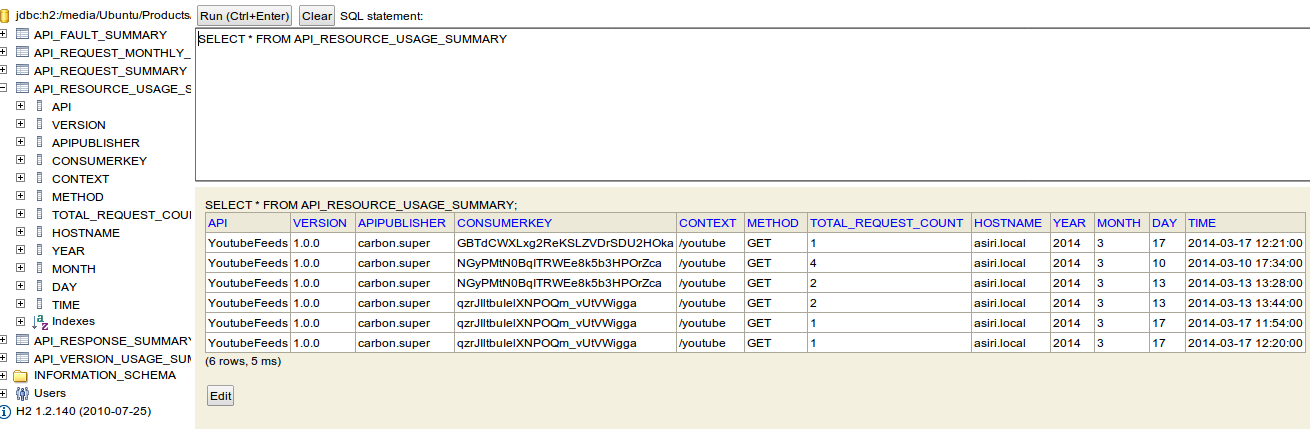
API Usage From Resource Path

As an organization implements SOA, it becomes beneficial to expose its core processes, data and services as APIs to the public. External parties can mash up these APIs in innovative ways to build new solutions. A business can increase its growth potential and partnership advancements by facilitating developments that are powered by its APIs. For example, the WSO2 Gadget Server leverages the Google Gadget API, ensuring that users of WSO2 Gadget Server can easily develop and deploy their own or third-party Google gadgets in it, in a simple, decentralized manner.
However, leveraging APIs in a collaborative manner introduces new challenges in exercising control, establishing trust, security and regulation. As a result, proper API management is crucial.
WSO2 API Manager overcomes these challenges through a set of features for API creation, publishing, life cycle management, versioning, monetization, governance, security etc. It provides Web interfaces for development teams to deploy and monitor APIs, and also an easy way to consumers to subscribe to, discover and consume APIs through a user-friendly storefront.
The WSO2 API Manager is an on-going project with continuous improvements and enhancements introduced with each new release to address new business challenges and customer expectations.
Project : Statistical view for API Manager Store as a new feature.
At that time only the API Manager Publisher had a statistic dashboard. So it was a major requirement for the APIM product for being able to provide stats on how API’s published in the APIM Publisher are invoked through applications in the APIM Store level. This will be primarily targeted at developers who subscribe to API's so that they can get insight into API usage from the store. An API subscription is associated with a given application that is using the API. A given API can also be subscribed to by many applications.
Initially it was required to identify exactly which stats should be shown in the APIM Store Statistics Page. After having discussions with the APIM team could come to a conclusion. Based on them below are the initial stats that we thought would be useful to have,
1. Per App / Per API call count
2. Per App / Number of registered users
3. Per App / Per API faulty invocation count
4. Per App / Per API call type
5. Per App / Top users
API Publisher Web application provides several statistical dashboards. So plan was to reuse code as much as possible for this scenario. But since the API store statistics were all based on per application basis it wasn’t possible to reuse queries written for database and other relative code. It had to be figured out what tables should be referred to collect required data and to inquire whether the prevailing database schema was sufficient for that particular task.
WSO2 Business Activity Monitor (BAM) is used to collect and analyze runtime statistics from the WSO2 API Manager. To publish data from the API Manager to BAM, the Thrift protocol is used. Information processed in BAM is stored in a database(AM_STAT_DB) from which the API Publisher retrieves information before displaying in the corresponding UI screens.By default, org.wso2.carbon.apimgt.usage.publisher.APIMgtUsageDataPublisher is configured to send data events to WSO2 BAM.
After analyzing each stat that needed to be added , could resolve that AM_STAT_DB should be modified due to not having Application related data. Using application consumer key it was possible to map each api invocation relating to application. Application information could be fetched from the AM_STAT database.
So had to modify the hive script to add column ‘consumerkey’ for following three tables
So had to modify the hive script to add column ‘consumerkey’ for following three tables
Cassandra Column Family - APIRequestData
h2 table - APIRequestSummaryData
h2 table - APIResourcePathUsageSummaryData
Cassandra Column Family - APIFaultData
h2 table - APIFaultSummaryData
After figuring out the tables which are relevant for the each stat and modifying it according to get the corresponding data next step was writing the queries to fetch the data from database. For this I’ve followed the conventions used for API publisher statistic dashboard backend in coding.
org.wso2.carbon.apimgt.usage component was responsible for publishing data to BAM and also for fetching data from databases. I modified the org.wso2.carbon.apimgt.usage.client/1.2.2/src/main/java/org/wso2/carbon/apimgt/usage/client/APIUsageStatisticsClient.java class in order to convert data in database into appropriate DTOs. ( Data Transfer Objects )
For the fault count data the prevailing DTO of fault count could be used.
After completing coding necessary methods to provide appropriate DTOs next step was to modify org.wso2.carbon.apimgt.hostobjects/1.2.2/src/main/java/org/wso2/carbon/apimgt/hostobjects/APIStoreHostObject.java which allows jaggery to interact with java code from js code.
API Manager store uses Rhino engine to connect the java backend and jaggery UI.
API Manager store uses Rhino engine to connect the java backend and jaggery UI.
Applications use script engines generally in one of two ways: embedding, which means external (e.g. user-defined) scripts are called by the application, or scripting, which means that an external script calls a Java application (or library) for its own purposes. Here it’s used for scripting.
Above figure shows the file structure of the API store UI. Once the required methods were coded in apiStoreHostObject class to make them usable for that jaggery ui through rhino engine those methods should be added under a module. In the statistics directory under the module directory there are module.jag file and usage.file. In the usage.jag file those methods were accessed and return types were set. In the module.jag all those functions were taken in to one module called statistics.
Once a particular stat page is requested through UI the request is directed to the relevant template. Then the js relevant to that particular page will render it. This js calls the related js under the block directory by which the module (statistics) created earlier is called upon request.
Then the json result will pass along the path. I’ve used dojo library to show stats in more graphical manner.
Following are the result graphs and tables that had been created for the API manager store web application.
Faulty Invocations Per Application
Registered Users For Applications and Top Users For Applications
API Usage Per Application
API Usage From Resource Path
No comments:
Post a Comment